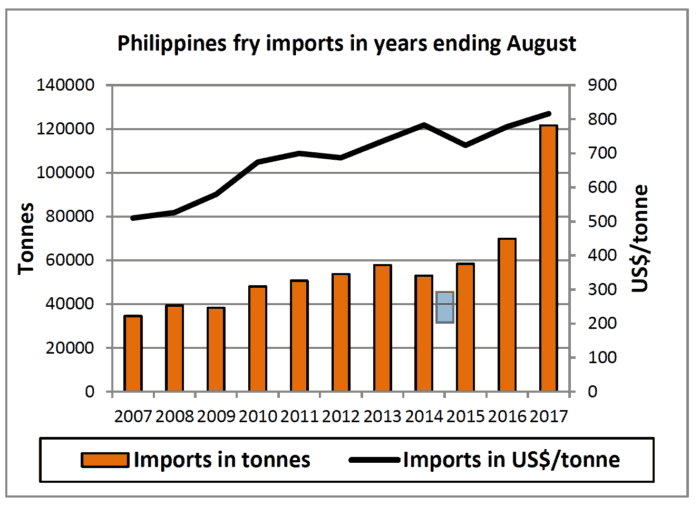
The Philippines is the fastest growing fry import market in the world, with demand up 74.0% to 121,652 tonnes in the year ending April 2017. In April 10,841 tonnes of fries were imported, an increase of 29.7% on the April 2016 figure.
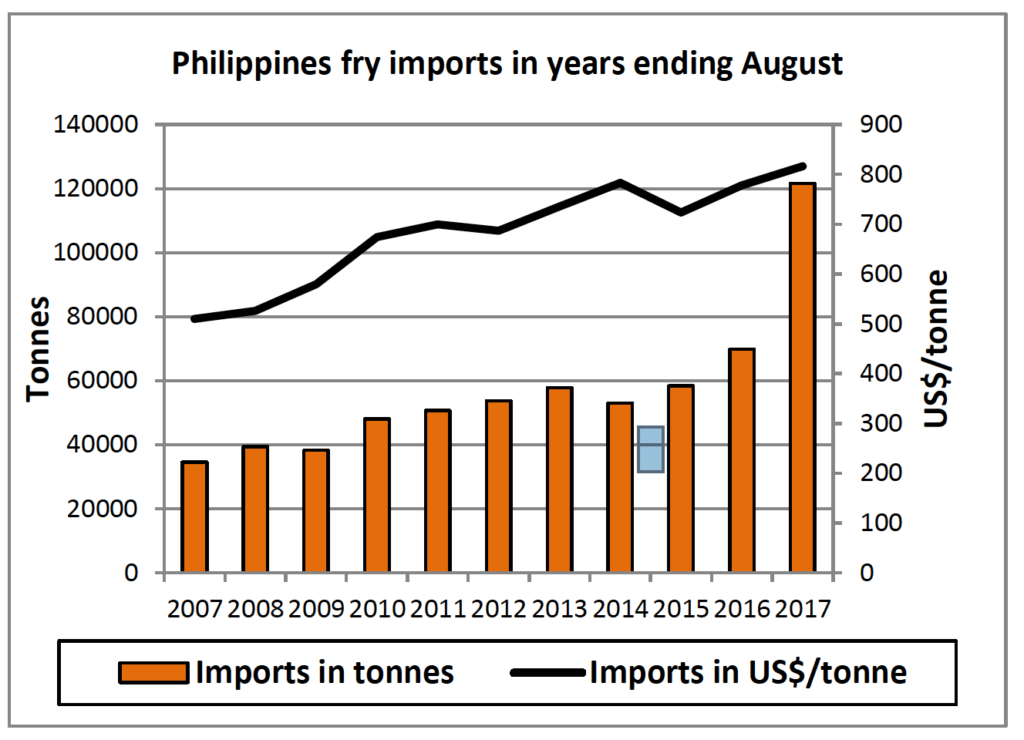
The average price of fry imports in April was Peso 41,671/tonne, up 15.3% on the same month last year. However, the year ending price when calculated in US dollars in April 2017 was up by only 4.9% to US$816/tonne.
All four of the world’s main fry exporting nations have benefitted from the increase in demand from the Philippines. US fry imports rose by 30.0% to 52,344 tonnes in the year ending April 2017 and there was a 11.2% increase in April to 4,225 tonnes. The average price of US fries has increased by 11.4% to Peso 42,543/tonne over the year.
Belgian imports increased by 75.2% over the annual period to 29,803 tonnes, with a 52.3% increase in April trade to 3,122 tonnes. The average price of Belgian fries has increased by 15.8% over the last year. Canadian and Dutch imports have both increased by more than 200% over the last year, but while there was an 80.1% increase in Dutch fry imports in April, there was a 16.0% drop in demand for Canadian product during the month.
US exporters to the Philippines are being helped by some stability in the value of the Peso against the US dollar. The current rate of US$1=Peso51.2 is 10.4% stronger than a year ago, similar to the rate at the beginning of 2017. That compares with a rapid strengthening of the euro against the Peso over the last year. The current rate of €1=Peso60.4 is 15.5% stronger than a year ago with most of that strengthening taking place since April. There has also been a 7.2% increase in the value of Canadian dollar since April to Ca$1=Peso40.3.
Philippines imports of fries and other HS 200410 products (tonnes, Peso million, Peso/tonne)
| April: | May-April: | |||||||
| 2017 | % ch’ge | 2016 | 2015 | 2016/17 | % ch’ge | 2015/16 | 2014/15 | |
| A.Tonnes | 10841 | +29.7 | 8358 | 4848 | 121652 | +74.0 | 69909 | 58332 |
| United States | 4225 | +11.2 | 3801 | 1288 | 52344 | +30.0 | 40260 | 35632 |
| Belgium | 3122 | +52.3 | 2050 | 1352 | 29803 | +75.2 | 17013 | 11086 |
| Canada | 1136 | -16.0 | 1353 | 1846 | 17487 | +210.6 | 5630 | 7035 |
| Netherlands | 1668 | +80.1 | 926 | 270 | 16999 | +208.3 | 5513 | 3952 |
| New Zealand | 349 | na | 0 | 0 | 2714 | na | 0 | 1 |
| Germany | 341 | +278.9 | 90 | 69 | 1622 | +87.5 | 865 | 208 |
| B.Peso million | ||||||||
| Total | 451.758 | +49.5 | 302.127 | 142.709 | 4839.566 | +91.1 | 2532.266 | 1869.751 |
| United States | 176.810 | +14.4 | 154.510 | 44.389 | 2226.879 | +44.8 | 1538.108 | 1230.962 |
| Canada | 127.225 | +95.4 | 65.094 | 38.132 | 1108.223 | +102.9 | 546.146 | 319.742 |
| Belgium | 52.470 | +20.6 | 43.522 | 49.012 | 664.947 | +249.1 | 190.468 | 170.207 |
| Netherlands | 64.819 | +103.8 | 31.802 | 8.298 | 622.281 | +216.2 | 196.779 | 129.463 |
| Denmark | 17.884 | na | 0.000 | 0.000 | 134.624 | na | 0.000 | 0.074 |
| Germany | 12.550 | +343.9 | 2.827 | 2.181 | 58.690 | +71.2 | 34.287 | 6.669 |
| C.Peso/tonne | ||||||||
| Total | 41671 | +15.3 | 36148 | 29437 | 39782 | +9.8 | 36222 | 32054 |
| United States | 41849 | +2.9 | 40650 | 34464 | 42543 | +11.4 | 38204 | 34547 |
| Belgium | 40751 | +28.3 | 31753 | 28204 | 37185 | +15.8 | 32102 | 28842 |
| Canada | 46189 | +43.6 | 32167 | 26550 | 38025 | +12.4 | 33831 | 24194 |
| Netherlands | 38860 | +13.2 | 34343 | 30734 | 36607 | +2.6 | 35694 | 32759 |
| New Zealand | 51243 | na | na | na | 49603 | na | na | 74478 |
| Germany | 36804 | na | 0 | 31608 | 36184 | -8.7 | 39638 | 32065 |
| Note: * Products covered by Harmonised System code 200410. Source: IHS GTA | ||||||||
Reproduced with permission from World Potato Markets Issue 330.