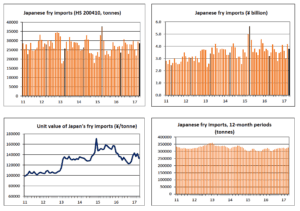
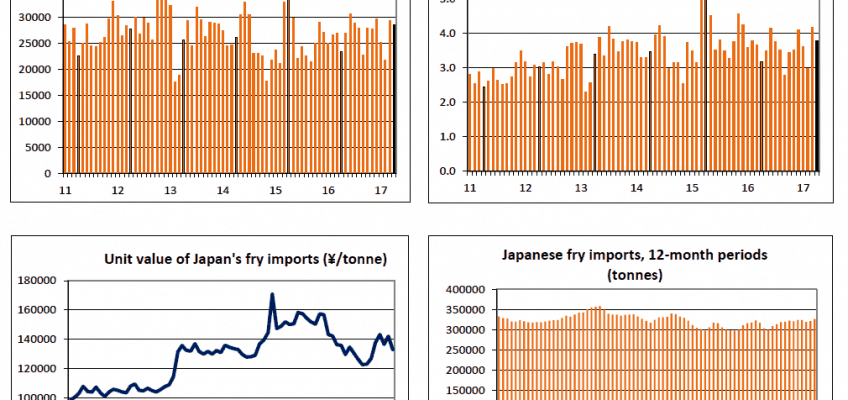
Demand for imported fries increased by more than a fifth in April compared to the same month in 2016, with New Zealand, the US, Belgium and Canada all benefitting from increased sales. Annual imports in the year ending April 2017 were 327 069 tonnes, up 7.9%. Lower prices appear to have driven increased demand – the price of imports over the last year has dropped by 11.5% to ¥132 323/tonne, which was 11.5% lower than in the previous 12 months. The current exchange rate is US$1: ¥110.5 and €1: ¥124.5.
 Imports from the New Zealand were up 95.2% to 322 tonnes, from 165 tonnes in the previous year. Annual imports were up 15.5% to 248 367 tonnes or 75.9% of the total, which was up from 70.9% in the previous 12 months. The average price of imports has fallen by 12.4% to ¥136 022/tonne.
Imports from the US were up 22.4% to 21 262, accounting for 74.3% of the total, which was the same percentage the year before. Annual imports were up 15.5% to 248 367 tonnes or 75.9% of the total, which was up from 70.9% in the previous 12 months. The average price of imports has fallen by 12.4% to ¥136 022/tonne.
Belgian imports have fallen by 22.4% to 26 484 tonnes over the last year, but were up by a similar proportion in April to 2 683 tonnes. The average price of Belgian imports was down 12.2% to ¥110 022/tonne over the year, but are still higher than Dutch product. Imports from the Netherlands have increased by 13.3% over the last year to 22 939 tonnes, but were only up by 2.6% in April to 2 073 tonnes. The average price of Dutch fries in April was ¥98 619/tonne, down 5.5%, which has probably helped demand.
There was a 27.1% increase in Canadian fry imports in April to 1 405 tonnes but, over the year, imports have fallen by 21.6% to 18 284 tonnes. The average price of Canadian fries in April was ¥136 705/tonne, down 6.7% on same month in 2016. Germany is the highest priced supplier of fries of all the main suppliers and that has impacted on demand from the country, which has fallen by 11.1% to 2 682 tonnes. In contrast, Egypt has benefitted from the lower price of its fries. The average price of Egyptian fries in April was ¥93 814/tonne, down 12.1% on the April 2016 figure. Over the year imports from Egypt have increased by 77.3% to 2 465 tonnes.
| Japanese imports of fries and other HS 200410 products (tonnes, ¥ billion, ¥ /tonne) | ||||||||||
| A. Tonnes | 2017 | % change | 2016 | 2015 | 2016/17 | % change | 2015/16 | 2014/15 | ||
| Total | 28492 | +22.1 | 23344 | 37514 | 327069 | +7.9 | 303126 | 317210 | ||
| United States | 21162 | +22.4 | 17294 | 27087 | 248367 | +15.5 | 214972 | 242317 | ||
| Belgium | 2683 | +22.5 | 2190 | 3574 | 26484 | -22.4 | 34126 | 21966 | ||
| Netherlands | 2073 | +2.6 | 2021 | 2562 | 22939 | +13.3 | 20240 | 12195 | ||
| Canada | 1405 | +27.1 | 1105 | 2979 | 18284 | -21.6 | 23316 | 28991 | ||
| Germany | 138 | -52.2 | 289 | 176 | 2682 | -11.1 | 3017 | 2450 | ||
| Egypt | 370 | +740.9 | 44 | 66 | 2465 | +77.3 | 1390 | 1570 | ||
| New Zealand | 322 | +95.2 | 165 | 624 | 1984 | -8.0 | 2156 | 3953 | ||
| France | 159 | +148.4 | 64 | 128 | 1878 | +18.6 | 1583 | 1364 | ||
| B. ¥ billion | 2017 | % change | 2016 | 2015 | 2016/17 | % change | 2015/16 | 2014/15 | ||
| Total | 3.793 | +19.6 | 3.172 | 5.633 | 43.279 | -4.6 | 45.344 | 44.904 | ||
| United States | 2.927 | +21.5 | 2.409 | 4.259 | 33.783 | +1.2 | 33.369 | 34.517 | ||
| Belgium | 0.291 | +18.4 | 0.246 | 0.422 | 2.914 | -31.9 | 4.277 | 2.781 | ||
| Canada | 0.192 | +18.6 | 0.162 | 0.469 | 2.506 | -30.2 | 3.592 | 4.249 | ||
| Netherlands | 0.204 | -3.1 | 0.211 | 0.262 | 2.236 | +1.2 | 2.209 | 1.385 | ||
| Germany | 0.020 | -55.6 | 0.045 | 0.022 | 0.409 | -9.5 | 0.451 | 0.359 | ||
| New Zealand | 0.043 | +83.6 | 0.023 | 0.100 | 0.267 | -19.2 | 0.331 | 0.559 | ||
| Egypt | 0.035 | +639.5 | 0.005 | 0.008 | 0.242 | +57.5 | 0.154 | 0.176 | ||
| France | 0.022 | +130.5 | 0.009 | 0.016 | 0.242 | +10.1 | 0.220 | 0.176 | ||
| C. ¥/tonne | 2017 | % change | 2016 | 2015 | 2016/17 | % change | 2015/16 | 2014/15 | ||
| Total | 133108 | -2.0 | 135888 | 150151 | 132323 | -11.5 | 149587 | 141559 | ||
| Germany | 145341 | -6.9 | 156176 | 126489 | 152375 | +1.8 | 149641 | 146401 | ||
| Canada | 136705 | -6.7 | 146596 | 157382 | 137056 | -11.0 | 154068 | 146579 | ||
| United States | 138293 | -0.7 | 139281 | 157228 | 136022 | -12.4 | 155223 | 142447 | ||
| New Zealand | 132335 | -5.9 | 140673 | 160378 | 134777 | -12.2 | 153466 | 141450 | ||
| France | 135969 | -7.2 | 146578 | 122422 | 128835 | -7.2 | 138764 | 128687 | ||
| Belgium | 108472 | -3.4 | 112232 | 118152 | 110022 | -12.2 | 125340 | 126591 | ||
| Egypt | 93814 | -12.1 | 106682 | 120045 | 98222 | -11.2 | 110626 | 111937 | ||
| Netherlands | 98619 | -5.5 | 104365 | 102373 | 97491 | -10.7 | 109131 | 113612 | ||
Reproduced with permission from World Potato Markets Issue 320 – 6 June 2017


