Sustainable Vegetable Systems Update No.11: Acknowledging and reducing soil nitrogen variability
Growing vegetables seems to be like juggling while standing on marbles. Then it rains.
Built upon many years of research and grower experience the Sustainable Vegetable Systems (SVS) project is developing a nitrogen budgeting tool. A key output will be guidance on fertiliser nitrogen application rates. It is also anticipated that the tool will build industry knowledge and further inquiry as growers delve deeper beyond the entry level defaults to tracking the impact of crop residues and soil nitrogen mineralisation.
To help explain this I have been making the analogy of a nitrogen budget compared to a financial budget. There are a series of inputs (fertiliser, soil mineralisation, and crop residue breakdown) or income, and outputs (harvested crop, volatilisation, and leaching) or expenditure. The soil mineral N, that part that is immediately available to the plant, is the bank balance. Where this analogy falls over is that at the end of each day you have a single absolute bank balance. In contrast the soil mineral nitrogen level must be representative of a wide range of conditions across a paddock. The sources of variability include soil type, slope, compaction, irrigation distribution, crop history, crop growth, harvest index, then throw in variability down the soil profile. It is just about enough to throw your hands up and walk away. However, you subconsciously deal with that variability every day and growers aren’t walking away (Ok some are, but I don’t think that is due to the variability of growing). What the budget does, be that financial or nitrogen, is that it documents what you anticipate will happen and then you plan accordingly.
Confidence in that plan or budget is built up understanding and reducing the variability as much as practical.
Variability – soil depth
Vertically through the soil profile mineral nitrogen varies considerably, even within the cultivated zone.
Soil testing guidance for vegetable cropping is often to sample to 15 cm. However, this is less than the active root zone of many vegetable crops. For most crops, sampling to a depth of 30 cm will be more representative of how much nitrogen the crop can access.
One of the barriers to soil testing is the time and effort spent doing it and increasing the sample depth only compounds this problem.
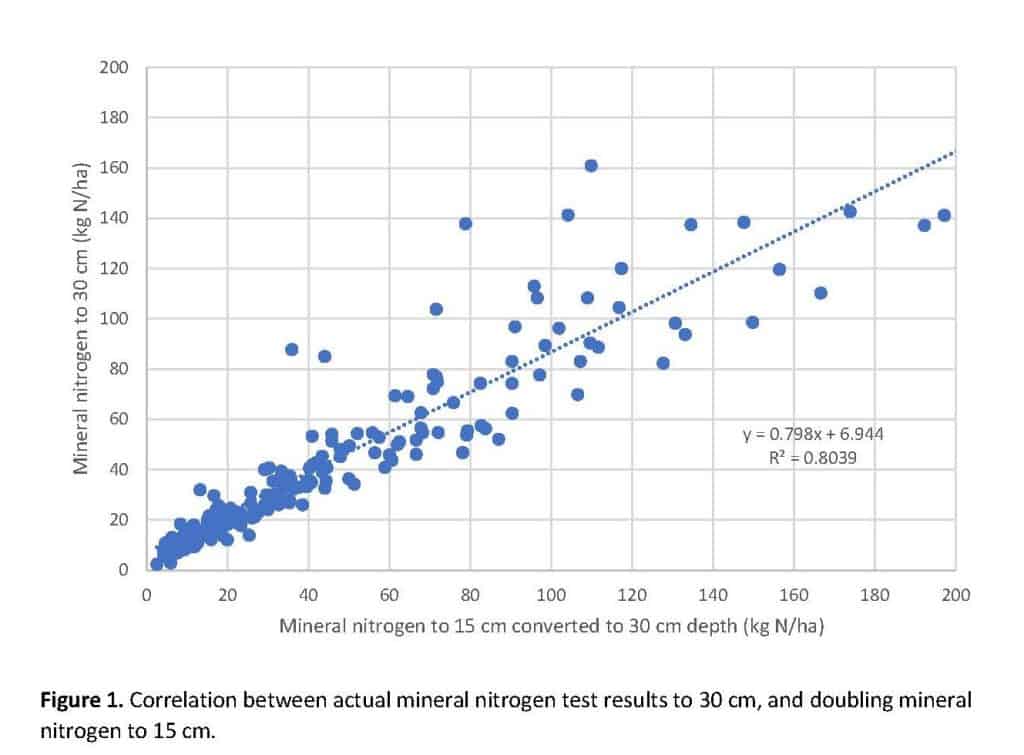
One possible solution is to continue sampling to 15 cm and simply double the results. To be confident that the resulting nitrogen prediction is reasonably accurate we analysed a large number of samples from across the country.
Table 1 demonstrates that in most cases simply doubling the mineral nitrogen content from a 15 cm sample will get reasonably close to the result obtained by taking a 30 cm sample, on average there was a less than 10% difference. This was a difference of just 4 kgN/ha, with the quartile range of -3 to 8 kgN/ha.
Table 1. Measured verses estimated mineral N to 30 cm
| Gold standard – measured | Estimated | Diff. from Gold standard | ||||
| 0 – 15 cm | 15 – 30 cm | 0 – 30 cm | 0 – 30 cm (0 – 15 cm x 2) | kgN/ha | % | |
| Average | 26 | 22 | 48 | 52 | 4 | 108% |
| Lower quartile | 8 | 8 | 17 | 16 | -3 | 92% |
| Upper quartile | 35 | 25 | 57 | 71 | 8 | 125% |
| Average | ||||||
| < 50 kg N/ha in top 15 cm | 17 | 17 | 35 | 35 | 0 | 100% |
| > 50 kg N/ha in top 15 cm | 81 | 53 | 134 | 162 | 28 | 121% |
What we found was that when the mineral N levels were greater than 50 kgN/ha in the top 15 cm, then doubling the 15 cm result to estimate nitrogen in the top 30 cm resulted in an overestimate by about 30 kgN/ha. On average there was 130 kgN/ha sitting in the top 30 cm, doubling the top 15 cm result estimated 160 kgN/ha. Generally, there is more nitrogen in the top 15 cm, particularly at higher nitrogen levels, hence the overestimate. As nitrogen levels decrease the differences between the layers becomes less distinguishable, and certainly much less significant from a crop nitrogen management perspective.
Based on the above analysis, simply doubling the 0-15 cm sample to estimate nitrogen to 30 cm could be used by growers to save time. However, caution should be taken after rainfall events (N might have been flushed out of the top 15 cm and now sitting at 30cm), and at higher nitrogen levels.
Variability – Nitrate Quick Test
SVS has conducted nearly 300 Nitrate Quick Tests across 4 of the regional Workstream 2 sites.
For each date and depth, the test results were averaged and compared to laboratory nitrate results. Overall, there is a strong correlation between laboratory results and the Nitrate Quick Test (Figure 2).
Generally, what we found is that the N Quick Test returns a smaller quantity of nitrate than the laboratory KCl extraction (nitrate component), with the difference increasing as the quantity of nitrate increases.
We found the average difference between the two test types is approximately 5.4 mg NO3-N/kg dry soil, which translates to approximately 8 kg N/ha difference. This should provide enough accuracy and confidence that the rapid results are a sound basis for making nitrogen management decisions. The experience of other growers who have been using the N Quick Test, is that with time accuracy improves, particularly if one person can be made responsible and good systems are put in place.
In general, the N Quick test was underestimating soil nitrate levels. Therefore, they are conservative which gives greater assurance when used as a guide to ground truth what is happening in the field against a nitrogen budget.

Nitrate Quick Tests can be order Lab Supply and FAR has a very good guide. You can view the SVS Quick-N test guide on the PNZ YouTube Channel https://youtu.be/UrY8yAvtVvY