Diversity of fry sales pushes NZ exports to new highs
New Zealand’s fry exports continue to reach new highs, with strong demand from Asian Pacific markets as well as established customer Australia.
In February 5,905 tonnes were shipped, more than double the volume exported in February 2017, with annual sales up 28.0% to 75,911 tonnes, beating the highs seen in 2008 and 2009. The average price of New Zealand fry exports in February was NZ$1,271/tonne.
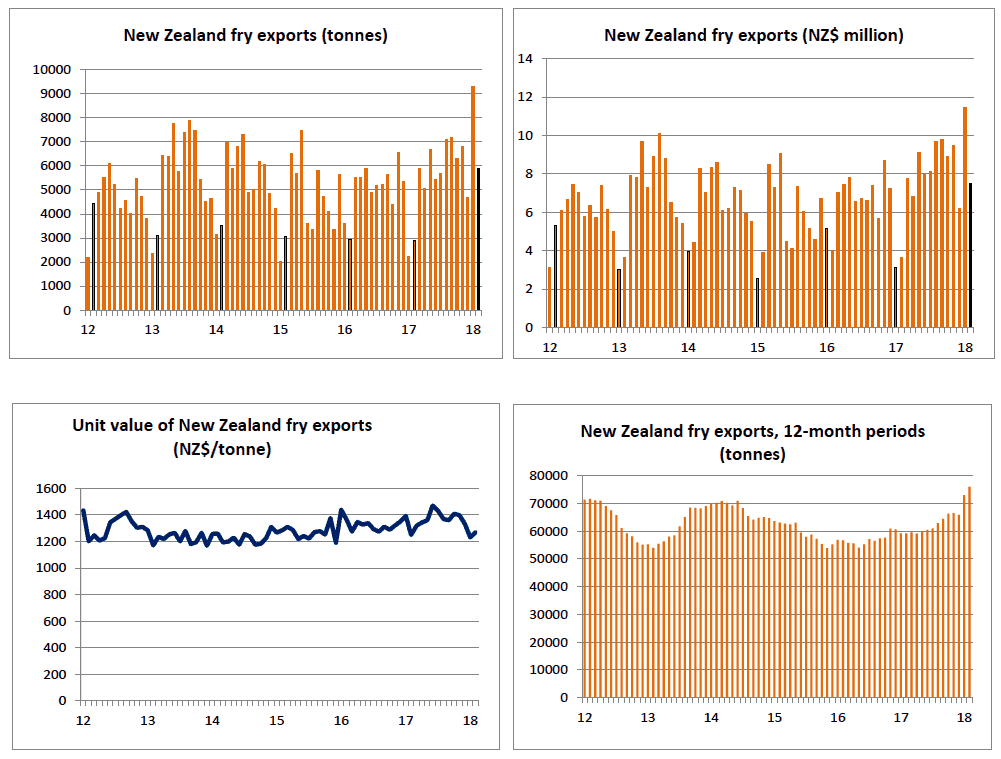
Exports to Australia were 57.5% higher in February at 3,896 tonnes, with annual shipments up 24.8% to 53,970 tonnes.
Aside from the solid growth in sales to its most important markets, the standout performer over the year has been China, with sales to the country up 327.9% to 5,306 tonnes and February shipments at 1,335 tonnes.
These figures do not tally completely with Chinese import figures, but that might be accounted for in shipping times and time taken in customs declarations. Whatever, the actual picture is, it is clear that exports to China have increased rapidly in the first two months of this year.
Sales to Thailand have increased by a third over the last year and by a half to the Philippines, while they were up two thirds to Japan.
| New Zealand exports of fries and other HS 200410 products (tonnes, NZ$ million, NZ$/tonne) | |||||||||
| February: | March-February: | ||||||||
| 2018 | % change | 2017 | 2016 | 2017/18 | % change | 2016/17 | 2015/16 | ||
| A.Tonnes | 5,905 | +103.3 | 2,904 | 2,930 | 75,911 | +28.0 | 59,321 | 56,747 | |
| Australia | 3,896 | +57.5 | 2,473 | 2,318 | 53,970 | +24.8 | 43,255 | 45,370 | |
| China | 1,335 | 0 | 0 | 5,306 | +327.9 | 1,240 | 538 | ||
| Thailand | 36 | +414.3 | 7 | 53 | 5,300 | +34.4 | 3,943 | 2,180 | |
| Philippines | 223 | 0 | 0 | 3,387 | +51.1 | 2,242 | 0 | ||
| Japan | 142 | +51.1 | 94 | 74 | 3,001 | +65.4 | 1,814 | 2,970 | |
| French Polynesia | 45 | +95.7 | 23 | 126 | 911 | +0.2 | 909 | 1,252 | |
| Papua New Guinea | 71 | +65.1 | 43 | 141 | 838 | -30.5 | 1206 | 1,005 | |
| B.NZ $ million | |||||||||
| Total | 7.504 | +106.7 | 3.630 | 3.993 | 102.697 | +31.9 | 77.883 | 72.508 | |
| Australia | 4.999 | +67.6 | 2.983 | 2.978 | 68.755 | +29.7 | 53.014 | 54.586 | |
| Thailand | 0.060 | +457.9 | 0.011 | 0.084 | 9.096 | +36.1 | 6.683 | 3.593 | |
| China | 1.435 | 0.000 | 0.000 | 6.268 | +370.4 | 1.333 | 0.566 | ||
| Philippines | 0.361 | 0.000 | 0.000 | 5.483 | +62.6 | 3.372 | 0.000 | ||
| Japan | 0.209 | +44.4 | 0.145 | 0.131 | 4.541 | +56.0 | 2.910 | 4.733 | |
| French Polynesia | 0.085 | +114.9 | 0.039 | 0.271 | 1.885 | -2.4 | 1.931 | 2.488 | |
| Papua New Guinea | 0.101 | +58.4 | 0.064 | 0.202 | 1.431 | -17.5 | 1.734 | 1.458 | |
| C.NZ$/tonne | |||||||||
| Total | 1,271 | +1.7 | 1250 | 1363 | 1,353 | +3.0 | 1,313 | 1,278 | |
| French Polynesia | 1,879 | +9.9 | 1711 | 2150 | 2,069 | -2.6 | 2,125 | 1,987 | |
| Thailand | 1,664 | +8.5 | 1533 | 1587 | 1,716 | +1.2 | 1,695 | 1,648 | |
| Papua New Guinea | 1,429 | -4.1 | 1490 | 1432 | 1,707 | +18.7 | 1,438 | 1,451 | |
| Philippines | 1,618 | 1,619 | +7.6 | 1,504 | 0 | ||||
| Japan | 1,474 | -4.4 | 1542 | 1766 | 1,513 | -5.7 | 1,604 | 1,594 | |
| Australia | 1,283 | +6.4 | 1206 | 1285 | 1,274 | +3.9 | 1,226 | 1,203 | |
| China | 1,075 | 1,181 | +9.9 | 1,075 | 1,051 | ||||
| Note: * Products covered by Harmonised System code 200410. Source: TDM. | |||||||||
Reproduced with permission from World Potato Markets issue 361, April 3, 2018