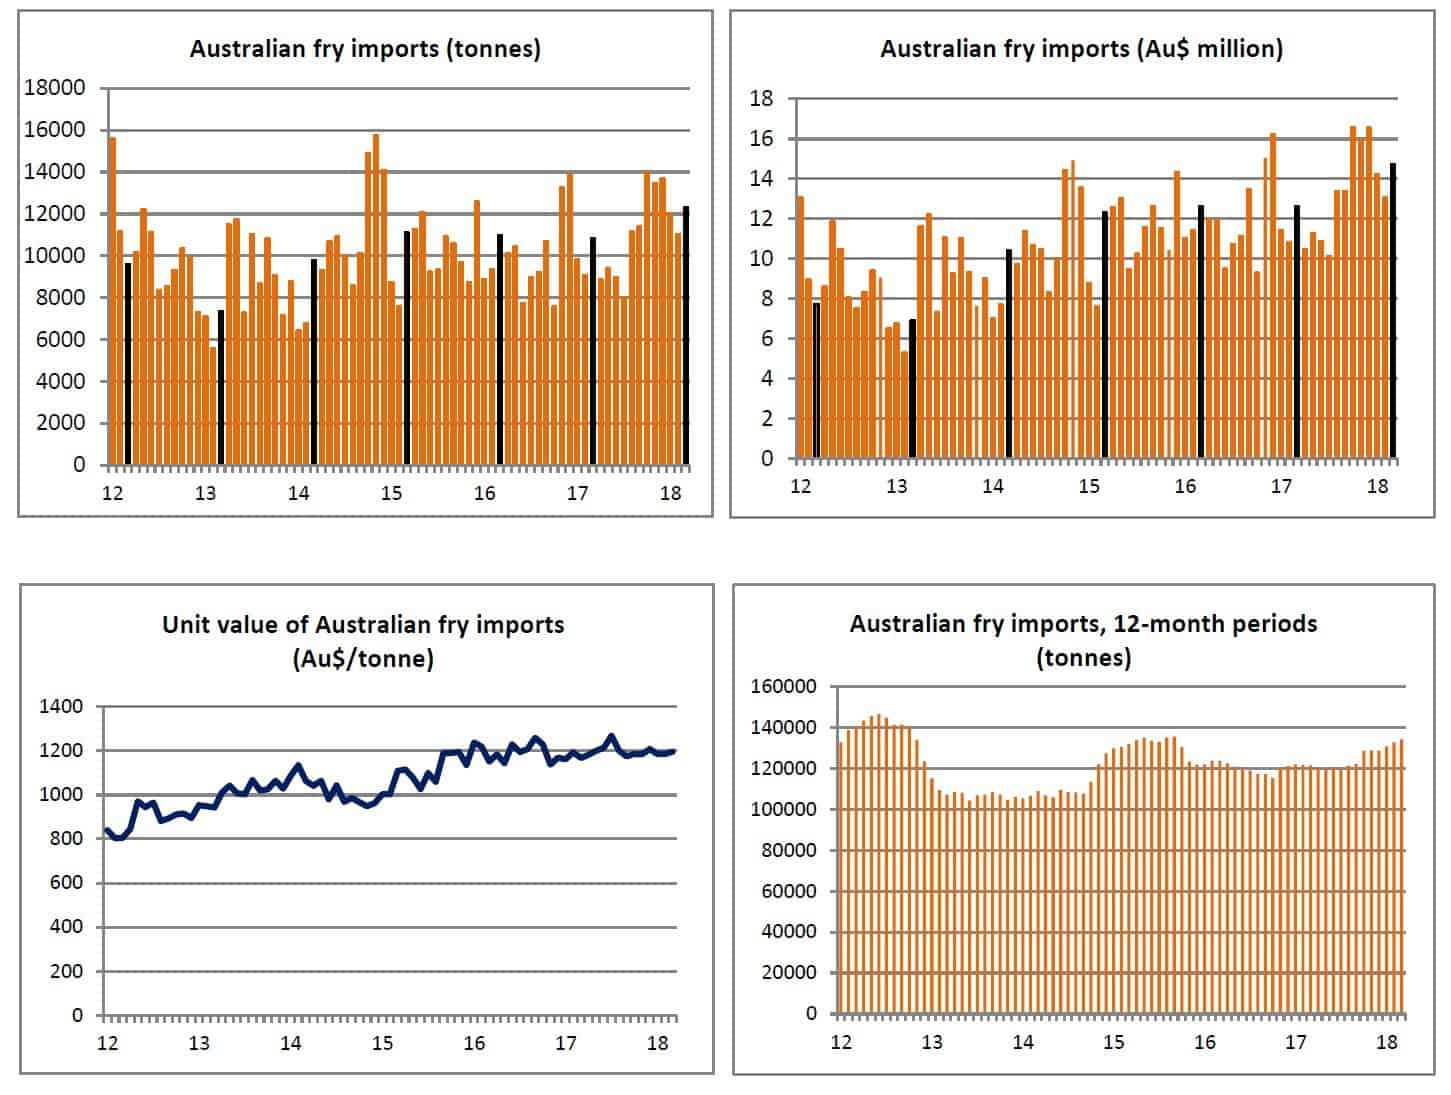
Australian fry import growth continues in March
The Australian which is an important export market for New Zealand fry exports is growing at more than 10% a year, with annual shipments at 134 113 tonnes in the year ending March 2018 – the highest volume since the year ending September 2015. March imports were up 13.7% to 12 303 tonnes. The average price of imports in March was Au$1 195/tonne, 2.4% higher than in March 2018. The current exchange rate is US$1=Au$1.33 or US$1=Au$1.59.
 Imports from New Zealand were 22.8% higher in the year ending March 2018 than the previous 12 months at 51 587 tonnes, with March trade 9.4% higher at 4 723 tonnes. The average price of New Zealand fry imports to Australia was Au$1 205/tonne, 14.1% higher than in March 2017.
European suppliers continue to make significant gains in the Australian market. The Netherlands is the lowest priced supplier in the market, with average prices at Au$1 034/tonne in March, 13.5% lower than the overall average price. Dutch imports have increased by 18.9% to 41 876 tonnes over the year and were at 4 259 tonnes in March, 31.9% higher than in March 2017. Belgian imports were 21.0% higher in the year ending March at 14 380 tonnes, with March trade 60.6% higher at 1 566 tonnes. In contrast, US imports were down 24.3% to 22 675 tonnes over the year and by 28.5% to 1 508 tonnes in the month itself.
| Australian imports of fries and other HS 200410 products (tonnes, Au$ million, Au$/tonne) | ||||||||
| March: | April-March: | |||||||
| 2018 | %change | 2017 | 2016 | 2017/18 | %change | 2016/17 | 2015/16 | |
| A.Tonnes | 12303 | +13.7 | 10816 | 10972 | 134113 | +10.4 | 121507 | 123618 |
| New Zealand | 4723 | +9.4 | 4316 | 4438 | 51587 | +22.8 | 42025 | 46104 |
| Netherlands | 4259 | +31.9 | 3230 | 3291 | 41876 | +18.9 | 35221 | 31161 |
| United States | 1508 | -28.5 | 2110 | 2116 | 22675 | -24.3 | 29962 | 31398 |
| Belgium | 1566 | +60.6 | 975 | 995 | 14380 | +21.0 | 11888 | 12143 |
| B.Au$ million | ||||||||
| Total | 14.707 | +16.5 | 12.622 | 12.621 | 160.492 | +11.4 | 144.082 | 140.743 |
| New Zealand | 5.691 | +24.8 | 4.559 | 4.326 | 58.794 | +27.8 | 45.989 | 47.584 |
| Netherlands | 4.403 | +36.9 | 3.217 | 3.443 | 44.839 | +28.6 | 34.878 | 28.162 |
| United States | 1.960 | -36.3 | 3.076 | 3.059 | 30.606 | -28.4 | 42.718 | 45.429 |
| Belgium | 2.278 | +53.2 | 1.487 | 1.355 | 20.086 | +24.6 | 16.115 | 14.900 |
| C.Au$/tonne | ||||||||
| Total | 1195 | +2.4 | 1167 | 1150 | 1197 | +0.9 | 1186 | 1139 |
| New Zealand | 1205 | +14.1 | 1056 | 975 | 1140 | +4.1 | 1094 | 1032 |
| Netherlands | 1034 | +3.8 | 996 | 1046 | 1071 | +8.1 | 990 | 904 |
| United States | 1300 | -10.9 | 1458 | 1446 | 1350 | -5.3 | 1426 | 1447 |
| Belgium | 1455 | -4.6 | 1525 | 1362 | 1397 | +3.0 | 1356 | 1227 |
Note: * Products covered by Harmonised System code 200410. Source: TDM.
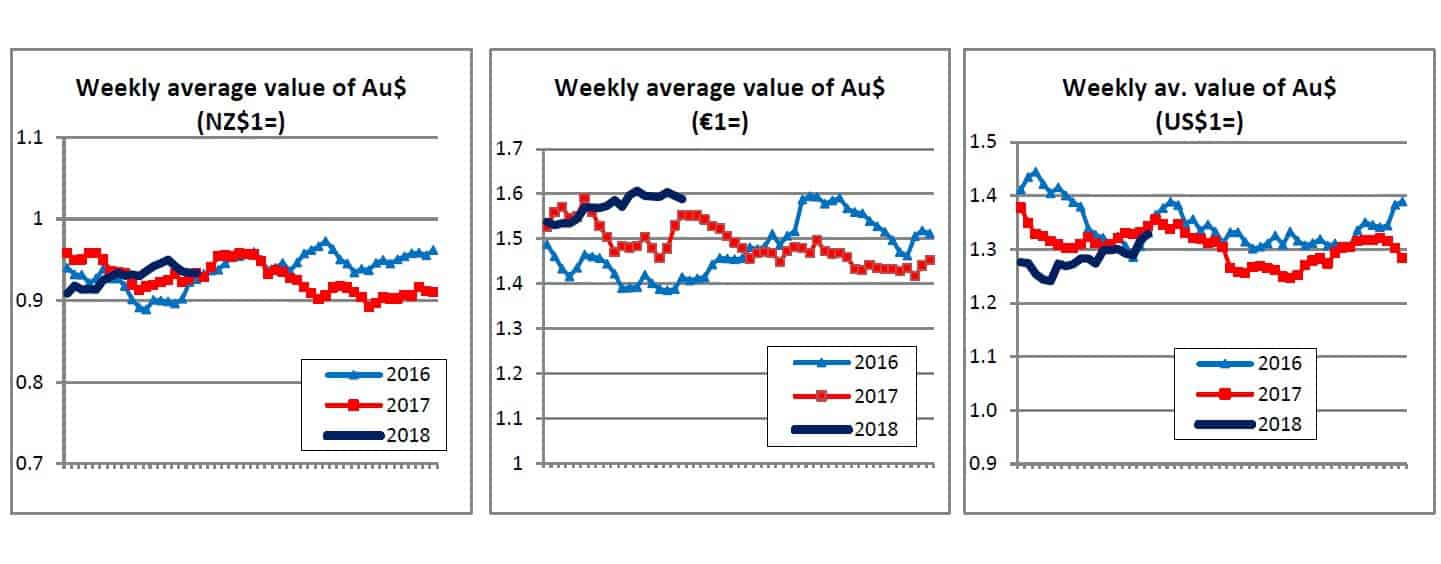
While the NZ dollar is tightly constrained against the Australian dollar, because of the importance of trade between the two countries, the Australian currency has this year weakened in value against the euro, making euro zone fries more expensive. It has also weakened against the US dollar, but in this case it has only returned values to the levels prevailing at this time last year.
Reproduced with permission from World Potato Markets issue 361, April 3, 2018