Sustainable Vegetable Systems Update No.4: individualised mineral N tracking reports
By Henry Stenning and Andrew Barber
Sustainable Vegetable Systems (SVS) – progress
The Sustainable Vegetable Systems (SVS) programme continues apace, with all four workstreams making significant progress, despite the extra obstacles created by Covid-19 lockdowns.
Workstream 1 – the intensive sampling programme – at Plant & Food Research’s (PFR) Hawke’s Bay and Lincoln research stations – has had broccoli, oats and pak choy harvested, with the sampling plots currently resown in lettuces, onions, and potatoes.
Workstream 2 – Regional monitoring of crop growth, crop nitrogen uptake and movement of nitrogen within soil: see below.
Workstream 3 – continues to make progress on the development of a grower nitrogen management tool, with modelling simulations being undertaken using the data gathered from Workstream 1. A group of model developers, model users, agronomists and growers met over 2 days to identify key issues and essentials for the future grower nitrogen management tool, giving the PFR modelling team further insights on grower input and output requirements.
Workstream 4 – Dissemination. Grower interviews are continuing, building upon the earlier online survey, in order to better understand the existing institutional grower knowledge, management practices, and key issues faced by growers with respect to nitrogen management on farms. A summary report has been prepared to feed into Workstream 3 to inform grower requirements for the tool under development. A webinar is planned to convey these findings to growers. The Workstream 4 leadership team is also planning a series of podcasts and videos for 2022.
Workstream 2 – why regional monitoring is important
The primary goal of the SVS programme is to produce a grower focused nitrogen management tool that consequently leads to reduced nitrate leaching. The modelling data obtained in Workstream 1 is fed into the model being developed in Workstream 3. Regional monitoring, the focus of Workstream 2, contributes to the model by collecting plant and soil samples across a geographically varied range of soil types and crop rotations. This data will be used to validate the model produced in Workstream 3 against real life grower practices and cropping conditions.
The other way in which Workstream 2 contributes to model development is by forming a core group of growers and regional monitors who will continue to increase their collective knowledge on the scientific principles of nitrogen in soils, soil nitrogen management practices, and the development and use of nitrogen budgets. Once the tool is further along in development this core group of growers, regional monitors of the SVS project, and agronomists will form a Community of Practice becoming the tool’s first test group. This group will provide further initial feedback on tool development and gain experience on practical application and use of the tool. This ‘Community of Practice’ will then be better able to disseminate this collective knowledge throughout the industry more effectively than if the tool was developed and released in isolation (without grower input).
Workstream 2 – what is being collected from the 9 regional monitoring sites
Sampling has continued on all 9 regional monitoring sites, from Pukekohe to Canterbury, sampling a range of crops across a range of soils: from the heavy Pukekohe clay loams to the light sandy loams in Matamata and Hawke’s Bay. Key activities carried out at each monitoring site includes soil sampling to 90 cm. This is matched at the same time with plant sampling, typically involving 3 samples of 1-metre of bed or 0.5 m2 of field, partitioned into above and below ground fractions. Additional activities conducted at each site include weather station monitoring, the installation and monitoring of soil moisture probes, and bulk density samples taken to convert nitrogen results from the lab (expressed as mg/kg) to a more relatable field basis (kg N/ha). The data collected through these activities will allow for nitrogen budgets to be created for each crop on each site, to improve our understanding of the movement of nitrogen within the system and across rotations, including quantification of the amount of nitrate that may have leached. Nitrogen budgets will be reported on in the next article in this series.
Workstream 2 – individualised soil mineral N tracking reports
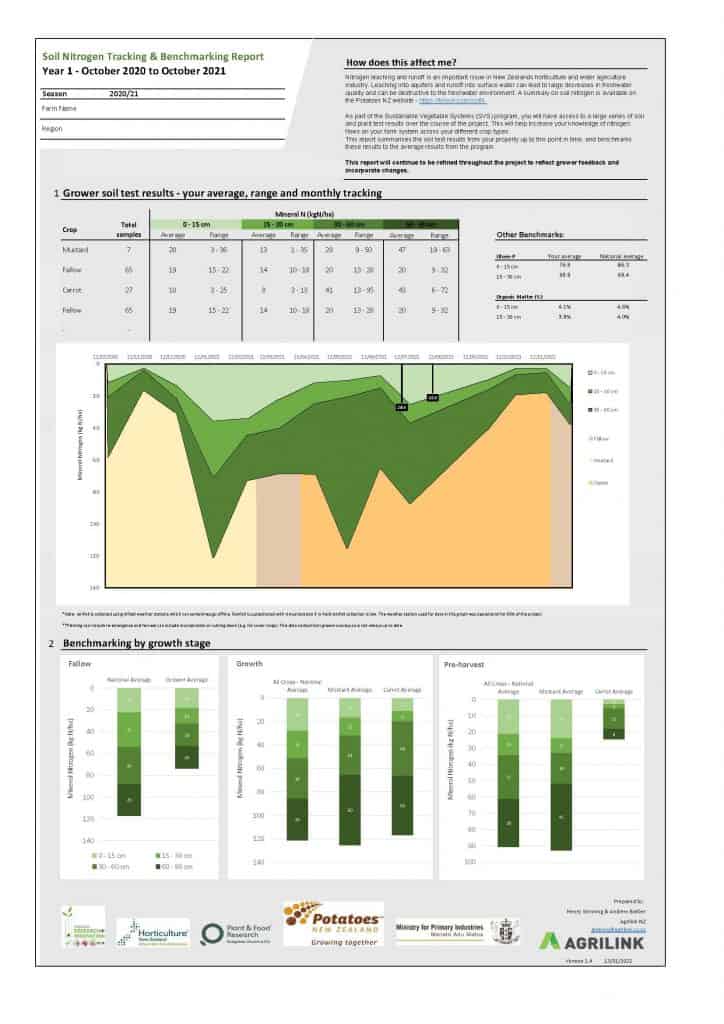
Our initial data reporting for the monitoring sites is on the soil mineral N fluctuation across the rotation, in a report shared with growers involved in the monitoring group (Figure 1).
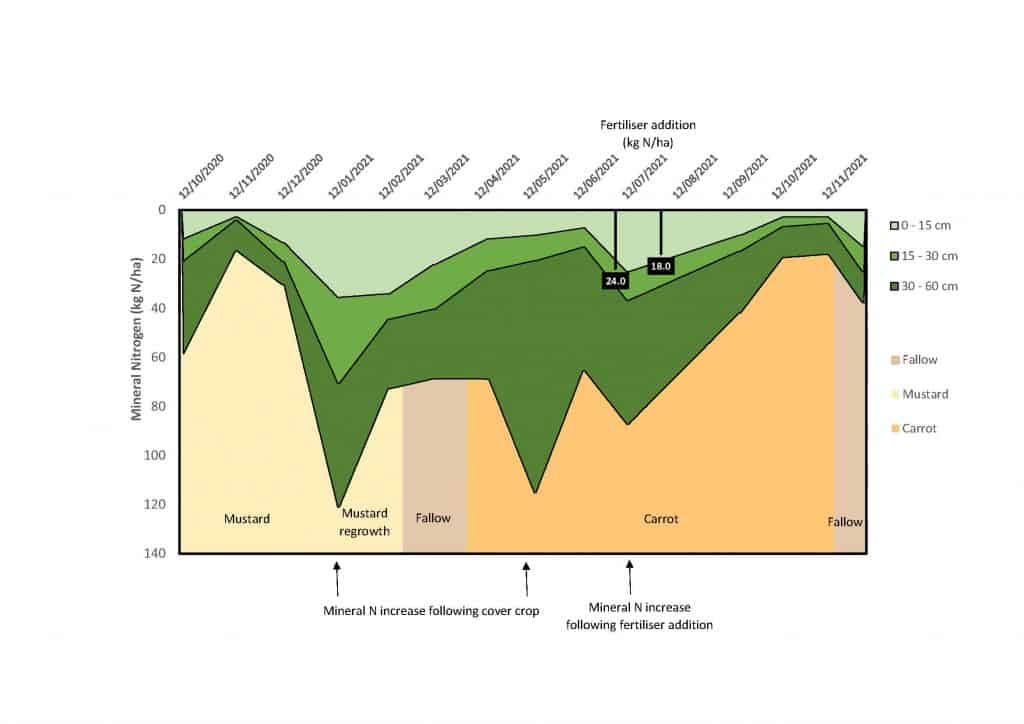
Growers and regional monitors alike have shown a lot of interest in the main graph in these reports (Figure 2), which shows the change in mineral nitrogen levels in the soil, as well as crop planting and harvest dates, nitrogen fertiliser applications, and rainfall.
Workstream 2 – learnings and questions raised by the mineral N tracking reports
Taking the graph shown in Figure 2 as our example, we can see large changes in mineral nitrogen in terms of its quantity and location in the soil profile over the course of 14 months. One of the most interesting contributors to changes in mineral nitrogen levels is the likely contribution of nitrogen from previous crop residues alongside the mineralisation of soil nitrogen into the plant available form. The peak of approximately 120 kg N/ha seen around mid-January 2021 happens to follow the incorporation of a mustard cover crop. Incorporation of crop residues, particularly in summer, can result in a large lift in mineral nitrogen as cultivation stimulates soil microbes to breakdown organic nitrogen into mineral forms (nitrate and ammonium). In this example, shortly after cultivation the mustard began to regrow, and the following rapid regrowth resulted in a significant decrease in mineral nitrogen over the following month.
The regrowth mustard crop was then incorporated, but this time mineral nitrogen levels did not spike again for a couple of months, with an increase evident shortly after the sowing of the carrot crop and after a brief period of fallow. The second spike (mid-May) in the 30 – 60 cm layer is very interesting. Cultivation can stimulate microbial activity and the formation of the carrot beds may have resulted in a consequent increase in soil mineralisation (release of mineral N from the organic N pool in the soil). Soil temperature, moisture, and aerobic/anaerobic conditions make a significant contribution to microbial activity and will have impacted both the rate of soil N mineralisation and crop residue breakdown.
In this particular case, the fertiliser nitrogen applied by the grower had a relatively low impact on mineral nitrogen levels, with a small lift (at most equivalent to the amount of fertiliser applied) in the upper soil profile observed following application around July – August 2021 (orange line and text box denoting the quantity of N applied). Soil mineral nitrogen was of course then taken up by the carrot crop during the main growth phase. An interesting observation is the change in mineral N in the 30 – 60 cm depth of the soil during this main growth phase. It is likely that some N was leached below the sampling depth by the high rainfall in September and October. As the growth phase finished the quantity of nitrogen in the soil plateaued, before increasing again following mixing and disturbance of the soil during carrot harvest as well as a result of the breakdown of some of the remaining crop residues.
Workstream 2 – how does this affect me?
Being able to track changes in soil mineral nitrogen allows growers to make informed decisions on future management practices. The main practices that affect nitrogen use efficiency are the crops chosen; the crop rotation; cultivation practice and timing; and fertiliser type, rate, application method and timing.
Crop rotations can be adjusted to some extent, although the crop grown, timing of sowing or planting and harvest are often dictated by market forces.
As shown above the action of cultivation as well as the return of crop residues can result in large quantities of mineral N, so timing the incorporation of residues to best match the following crop’s N demand and root development, and avoiding having high amounts of N in the soil during periods of high drainage can all help to reduce the risk of N leaching.
The central role of crop residue breakdown
Theoretically the nitrogen from crop residue breakdown can be estimated and considered in the following crop’s nitrogen budget, though the timing of nitrogen release and the quantity released is currently not well understood. Consequently, these questions form part of a concurrently running project specifically focused on crop residue breakdown. Additionally, it is well known that there is a time lag between residue incorporation, nitrogen release and availability for uptake by the following crop the length of which depends upon which type of crop was grown and other factors such as how much fertiliser that crop received. The growing database of soil and plant results should assist us to better estimate how long the crop residues will take to break down under a range of variable conditions.
Workstream 3 – A grower nitrogen management tool, decision support to lower the N leaching risk
The grower nitrogen management tool and the data sitting in behind it are at the heart of SVS. Our aim is to give growers the confidence to make changes in management practice while still being able to sleep at night. As one grower said, “getting it wrong puts many many jobs at risk”. Having the data to present to regulators and the public, optimising nitrogen strategies – by making a few critical decisions, will reduce nitrogen leaching risk on farms, thereby maintaining the social licence to operate, and increasing positive public perceptions of the industry’s leadership in environmental stewardship.