Republished with permission from author and HortNZ/NZ Grower
December 2021 magazine article
By Ailsa Robertson, Sustainability and Extension Manager
Image: Ministry for Environment [1]
The buildup of greenhouse gases (GHGs) in the Earth’s atmosphere as a result of human activities is causing the Earth’s climate to change. These gases trap heat in the Earth’s surface and warm the planet. Different GHGs have different lifetimes, with some short-lived gases present for a few years and some longer-lived gases present for thousands of years. GHGs accumulate in the atmosphere over time, with each year’s emissions added to the preceding year’s emissions.
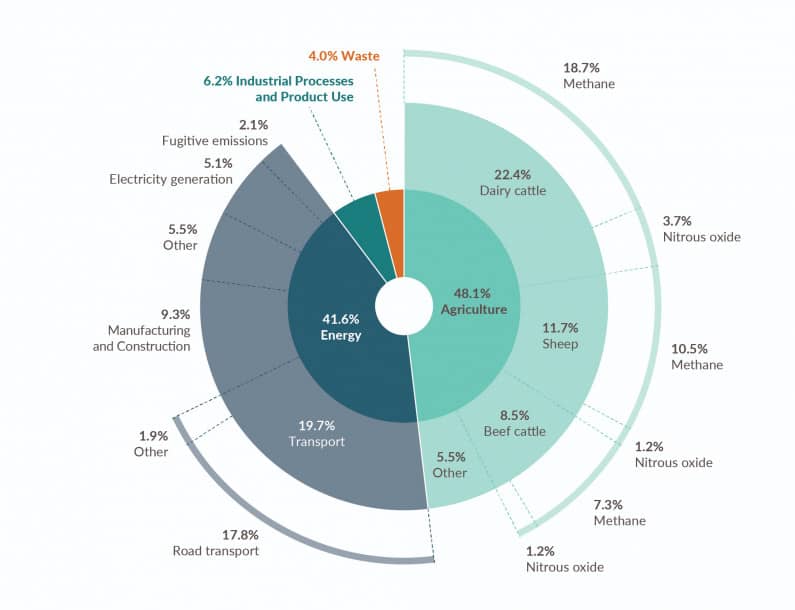
New Zealand’s share of global GHG emissions is small, but our gross emissions per person are high. Our GHG emissions have been relatively unchanged since 2005. In 2019 our gross GHG emissions were 82.3 million tonnes of carbon dioxide equivalent (Mt CO2-e), comprising 45% carbon dioxide, 42% methane, 10% nitrous oxide and 2% fluorinated gases.
The figure above shows the breakdown of NZ’s 2019 emissions by sector, sub-category, and gas type.
The agricultural sector is responsible for 48.1% of NZ’s gross emissions. Within the agricultural sector, 22.4% of emissions are from dairy cattle, 11.7% are from sheep, 8.5% are from beef cattle, and the remaining 5.5% are from other sources. Nitrous oxide emission from the application of synthetic nitrogen fertiliser is part of the ‘other’, accounting for 2.8% of NZ’s gross emissions, and 5.7% of NZ’s agricultural GHG emissions [2]
New Zealand has several domestic and international GHG emissions reduction targets [3]
Domestic targets under the Climate Change Response Act are:
- Net zero emissions (i.e. emissions are matched by removals) of all GHG other than biogenic methane by 2050, and
- 24 to 47 % reduction below 2017 biogenic methane emissions by 2050, including 10 % reduction below 2017 biogenic methane emissions by 2030.
He Waka Eke Noa – a partnership to reduce agricultural GHG emissions
NZ’s agricultural GHG emissions aren’t currently priced in the NZ Emissions Trading Scheme (ETS), whereas emission from other sources like fuel and electricity are priced in the ETS.
He Waka Eke Noa is a partnership between primary sector, Government and iwi/Māori to develop a system for measuring, managing, pricing and reducing agricultural GHG emissions, rather than simply putting farm products in the ETS.
He Waka Eke Noa is concerned with methane and nitrous oxide from animal emissions, and nitrous oxide from synthetic nitrogen fertiliser. He Waka Eke Noa is designing options for an alternative pricing system to the ETS for methane and nitrous oxide, and a process to recognise sequestration from a broader range of woody vegetation than is currently eligible for the ETS, such as native vegetation, shelterbelts and orchards.
A (methane) + B (nitrous oxide) – C (sequestration)
For growers that don’t have animals, this means from 2025 there will be a price on synthetic nitrogen fertiliser emissions either at the farm level based on annual quantities applied, or for all fertiliser sold at the point of purchase either the processor or fertiliser company.
There are two pricing options in addition to the ‘backstop’ default ETS option. The two alternatives are a farm-level levy or a hybrid-processor levy.
The He Waka Eke Noa partners, including Horticulture New Zealand, are planning engagement with farmers and growers in February 2022 on these pricing system options. Feedback from this engagement will form part of the final policy recommendations to the Minister of Climate Change and the Minister of Agriculture in April 2022.
The following table summarises the elements of each pricing system, followed by some examples of prices that growers could face based on the price of carbon in the ETS.
Pricing system options in He Waka Eke Noa
| ‘Backstop’ ETS | Farm-level levy | Hybrid-Processor levy | |
| Who pays the bill each year | Processor or fertiliser company | Individual grower or collective | Processor or fertiliser company or collective |
| Tax Type | Trading Scheme | Levy | Levy |
| Pricing: ApproachSetting3. Exposure | Carbon EquivalentETS MarketFree Allocation – 95% in 2025 and 1% phase-out per year | Split GasIndependent BodyTo be determined | Split GasIndependent BodyTo be determined |
| Who reports | Processor or fertiliser company | Individual grower (landowner or business owner – to be determined) | Voluntary through an Emissions Management Contract |
| Farm Plan | No | GAP farm plan | Voluntary through and Emissions Management Contract |
| Sequestration | Earn units for ETS eligible forestry | Offset with He Waka Eke Noa eligible woody vegetation | Offset with He Waka Eke Noa eligible woodyvegetation |
| Revenue invested back in R&D and technology | Yes | ||
| Administrative cost to participate and operate the system (not including the cost of emissions) per annum | $10,000,000 | $113,000,000 | To be determined |
| Emission Reduction Achieved by 2030 | 1% | 1% | 1% |
The table below presents two worked examples of the potential costs for emissions from non-urea fertiliser, for an apple orchard and a vegetable operation.
For each example, two scenarios are compared:
- 2025 cost based on a fully exposed ETS price of carbon ($85) and 95% free allocation (5% of full price), and
- 2030 cost based on a projected fully exposed ETS price of carbon ($135) and 90% free allocation (10% of full price).
For each scenario, costs are expressed as a lump sum cost per year, and a cost per hectare per year.
| Example growing system | $85/T CO2-e 2025 | 95% Free allocation | $138 CO2-e 2030 | 90% Free allocation |
| 20 ha orchard applying 50 kg N/ha | $460 or $23.0/ha | $24 or $1.2/ha | $730 or $36.5/ha | $72 or $3.6/ha |
| 100 ha vegetable farm applying 200 kg N/ha | $9,180 or $91.8/ha | $460 or $4.6/ha | $14,580 or $145.8/ha | $1,460 or $14.6/ha |
1 kilogram of non-urea fertiliser is equivalent to 5.4 kg of carbon dioxide equivalent (CO2-e).
As the partner organisation representing horticulture in He Waka Eke Noa, HortNZ has remained relatively neutral on the three pricing options to date, so long as they do not disadvantage horticulture with disproportionate cost relative to emissions. We want to hear growers’ views and feedback on these options when we go out for engagement in February 2022.
A grower’s story, how the Clarke’s are getting to grips with GHG emissions
Woodhaven Gardens in the Horowhenua has been figuring out how to reduce their impact on the climate. The Clarke family has been growing vegetables since the 1970s, growing 24 different crops across approximately 900 hectares. Woodhaven employs around 250 staff and sells 27 million individual vegetable units each year, accounting for about 10% of the national supply.
“In order to understand our environmental impact, we’ve had to get to know all of our paddocks individually”, says Jay Clarke. Their journey to understanding their emissions began when they were looking at ways to reduce nutrient leaching to freshwater.
Nitrous oxide is a potent and long-lived greenhouse gas that comes from a range of sources, including farming. In agriculture, it is emitted into the atmosphere when micro-organisms in the soil act on nitrogen introduced either by animal urine or dung, legume plants or nitrogen-based fertilisers.
“Figuring that out was actually really helpful for us because it meant we were getting a two-pronged approach,” says Jay. “We were already looking at nitrogen for freshwater quality. By tackling that, we’ve also been able to lower our greenhouse gas emissions.”
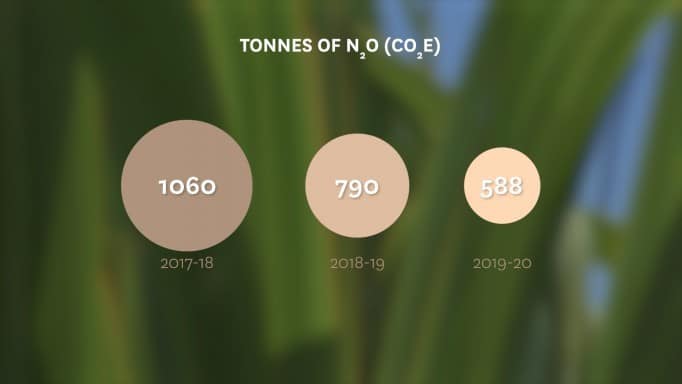
In 2019/20, Woodhaven Gardens emitted 588 tonnes of nitrous oxide, expressed as ‘carbon dioxide-equivalent’ – just under half what they emitted two years prior, and the equivalent of taking over 300 cars off the road.
Carbon dioxide equivalent describes the amount of carbon dioxide emissions that would provide the same warming effect over a specified period of time as the gas in question, in this case nitrous oxide.
Graphic showing tonnes of nitrous oxide emissions from Woodhaven Gardens, 2017-2020.
On-farm actions
The team at Woodhaven Gardens works hard to produce the most amount of food for the least amount of fertiliser. Here are the main things they’ve been doing to manage their nitrogen use:
- Tractor in a ploughed paddock with a planting unit on the back planting the next crop,
- Developed expertise in the crops they grow – understanding each one’s growth cycle and fertiliser requirements,
- Regular soil testing (via a Nitrate Quick test) to find out how much nitrogen is already in the root zone,
- Investment in precision agriculture systems to ensure fertiliser is applied exactly where it is needed and tight to the root zone, at the right rate and the right time.
“We GPS’ed our tractors so we know that our inputs go exactly where we want them to, and we don’t get fertiliser in the parts of the farm that don’t need it,” says Jay.
The Clarkes also pay attention to the health of their soil, using crop rotation and cover crops to further minimise the need for fertiliser.
“I never thought we’d get as far as this,” says Jay. “But by changing a whole lot of little things, and being willing to try different things, we’ve been able to add it all up and have a major impact. It’s something we’re really proud of.”
Jay says they are continuing to learn as they go and there are still parts of the system that need work, including monitoring whether the new, lower levels of fertiliser are sustainable across all seasons in the longer term.
[1] https://environment.govt.nz/publications/new-zealands-greenhouse-gas-inventory-1990-2019-snapshot/key-findings-of-the-2021-inventory/
[2] http://flrc.massey.ac.nz/workshops/19/Manuscripts/Paper_Gibbs_2019.pdf
[3] https://www.mfe.govt.nz/climate-change/climate-change-and-government/emissions-reduction-targets/about-our-emissions