Potatoes New Zealand Potato and Massey University Tuber Spectral Imaging Project
[columns] [span6]

[/span6][span6]
An agreement has been signed between PNZ, Massey University and the Food Industry Enabling Technologies to fund a three-year Potato Tuber Spectral Imaging Project.
A proof of concept study was conducted in 2017 by Massey University with the funding and support of Potato New Zealand Inc (PNZ) to investigate the potential of using near infrared (NIR) spectroscopy in detecting Zebra Chip disease in potato tubers. Zebra Chip disease is caused by the presence of Liberibacter, a bacterium carried by the Tomato Potato Psyllid. This study successfully demonstrated that spectral separation technology could segregate intact washed and non-peeled potato tubers with Zebra Chip disease. The successful outcomes from this study has led to funding support from the Food Industry Enabling Technologies (FIET) for a three-year project.
[/span6][/columns]
The project will apply vision-processing techniques of hyperspectral video images to generate a flat surface map of each rolling tuber, from which the probability of the presence of Zebra Chip disease and therefore Liberibacter infection will be established. The purpose of this project is to develop a system for spectral image-based sorting and grading of intact potato tubers. The objective is to perform laboratory and industrial testing and demonstration of hyperspectral image to predict tubers with the presence of Liberibacter and possibly other diseases.
To help growers understand where their levy funds are being directed we have provided below a brief overview of Spectral Imaging.
General Introduction of Spectral Imaging
Over the last few decades, sensing technology has advanced rapidly in agriculture area. Today, continuous development of miniature sensing instruments and commercial drones have become more affordable. These allow the grower to analyse their crop conditions in detail scale than ever before.
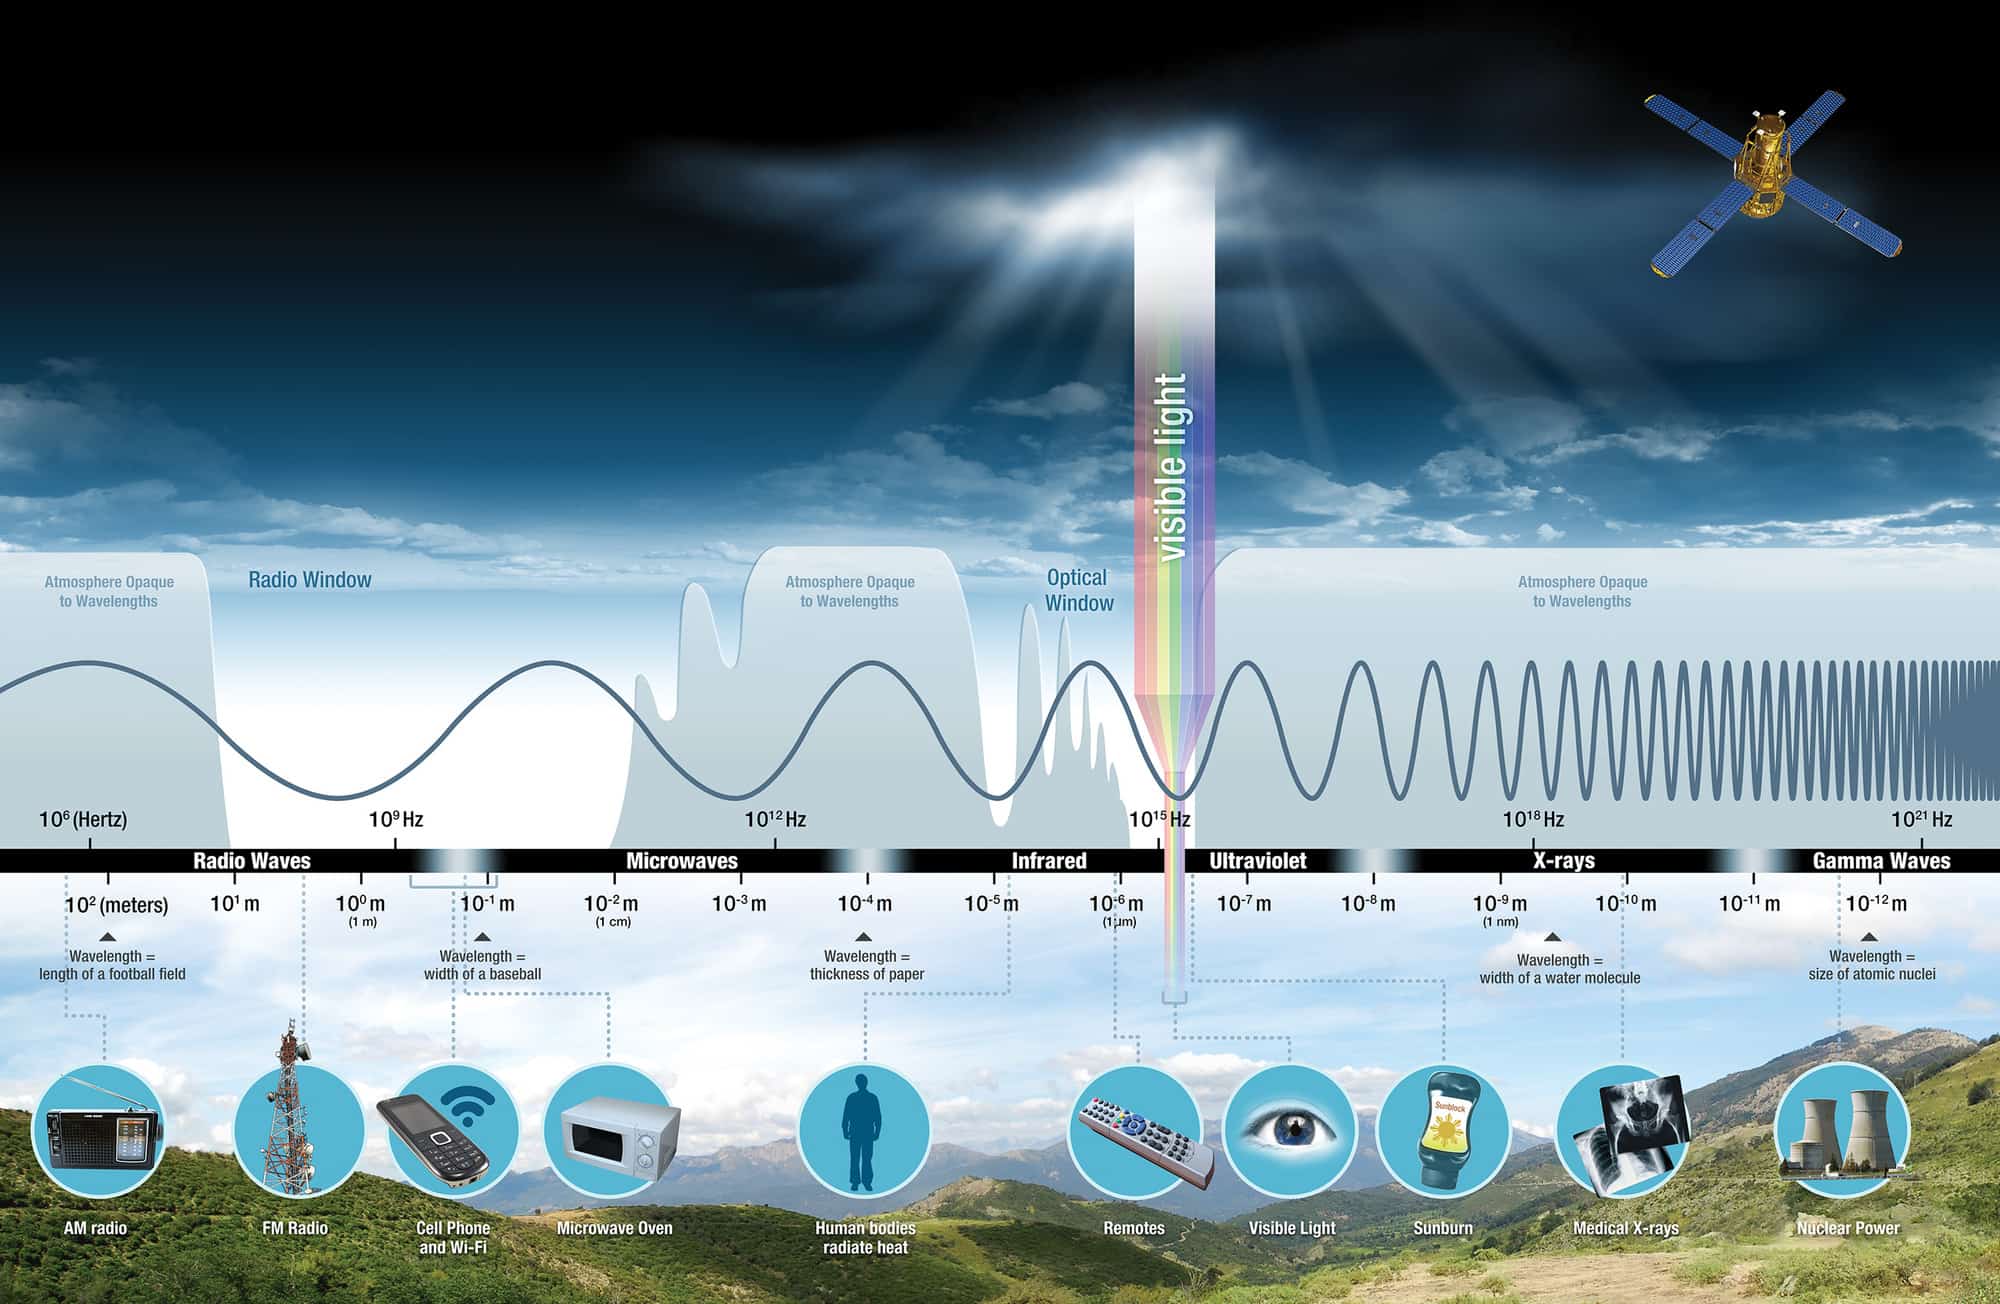
Every day we are using electromagnetic energy to function various things, for instance, watching TV, voice call, sending a text message, listening radio, microwave etc. This energy contains broad spectrum from radio waves to gamma rays (see figure below) which are classified based on frequency. Our eyes act as a sensor to detect only a small portion of the spectrum called visible light thus we recognise different objects based on colours and shapes. However, other parts of the spectrum (infrared) can be used to derive different characteristics of plants. Fundamentally, plants with different composition, physiology and reflects light differently. Sensors have been designed to detect this invisible information of the spectrum giving more insights than human eye alone.
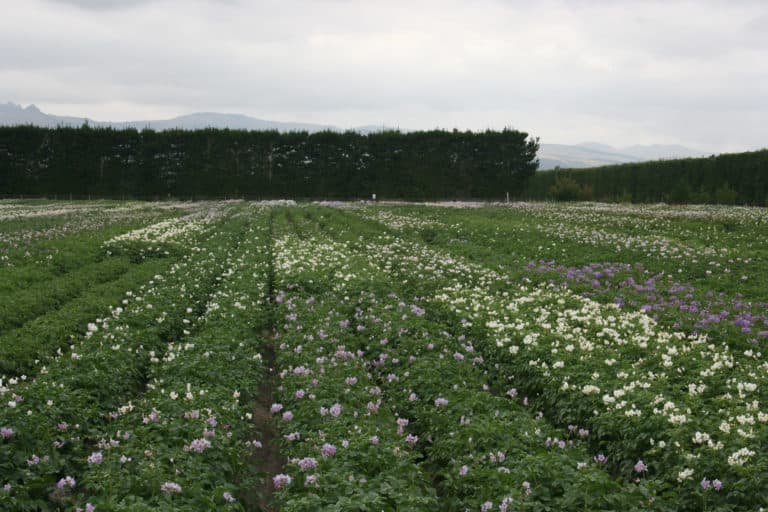
Types of spectral imaging include Normalized Difference Vegetative Index (NDVI) and Hyperspectral Imaging. NDVI is a measure of the health or density status, vigour or disease of plants on a patch of land. When sunlight reaches live plants, certain frequencies of light (visible; 400-700 nm) gets absorbed by the plant. The absorbed light used as a source of energy in the process of photosynthesis. On the other hand, other frequency of light (near-infrared; 700-1100 nm) is reflected.
Based on the light measurements in different regions (visible and near-infrared) NDVI is calculated to indicate various plant features. It is expressed by the following equation. Remember NIR means near infrared and VIS means visible.

[columns] [span6]
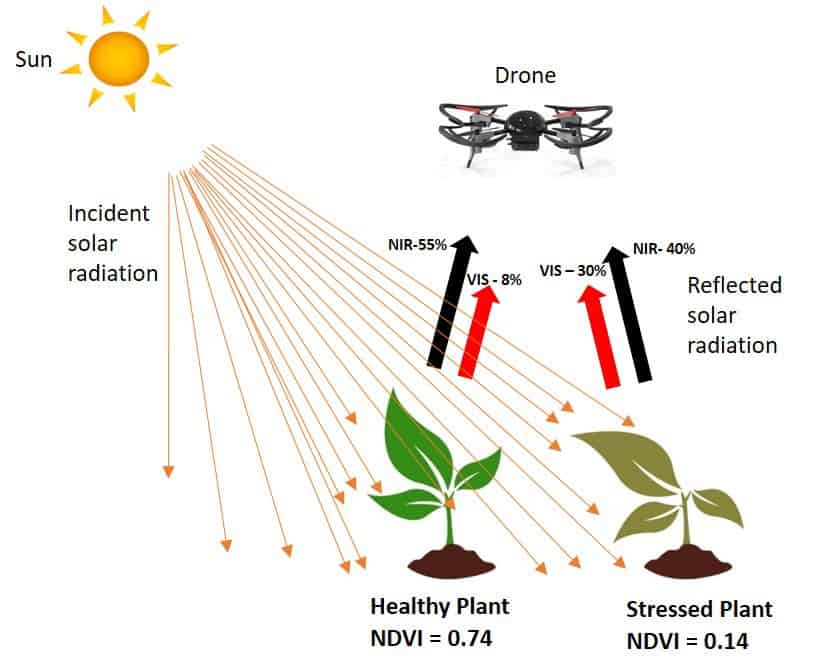
From the above equation, NDVI values ranges between -1 and +1. NDVI values of 0 and less than 0 refers to non-vegetation objects such as roads, buildings, soil and other objects. NDVI values above 0 indicates vegetation presence. Generally, healthy and dense vegetation has high values (0.50-1.0), while stressed and sparse vegetation has low values (0-0.5). An above 0.5 figure indicate light interaction with plants that are healthy and are absorbing most of the visible light and reflecting some visible green light thus it appears in green color, and a large proportion of near-infrared light is being reflected. Conversely, a stressed or poor performing plant reflects more visible light and less near-infrared light because it is not performing as it normally does – therefore it may appear yellow. In this case the number drops below 0.5. Based on this simple index or ratio, crop health can be measured using unmanned aerial vehicles by recording the NDVI status. But remember that the health of a crop can depend on a number of factors, it is the interpretation of the NDVI which is important.
[/span6][span6]
[/span6][/columns]
Hyperspectral Imaging – HSI
In contrast to NDVI, new tools such as hyperspectral imaging sensors have been developed to measure electromagnetic energy precisely in continuous narrow portions of the spectrum. Hyperspectral imaging tools measure light in hundreds to thousands (400-2500 nm) of bands enabling identification of fingerprints/signatures that contain both physical (shape, size, texture, orientation etc.) and chemical (water, fat, protein etc.) information, which can be used as basis to uniquely characterise, identify and sort food products.
This technology has emerged as a powerful technique because of many advantages including minimal, non-destructive nature, rapid and simultaneous assessment of several quality details, such as physiological disorders or diseases. This why PNZ is interested in using this technology to sort infected potatoes. It can be applied to a range of diseases and problems with tubers.
Researchers reported that HSI has potential to determine quality (pH, firmness, color, sugar, starch, acidity, bruise, essential oils, pigments, dry weight, sensory properties) of various produce (apples, kiwifruit, oranges, grape, mandarin, melon, cherry, apricot, plum, blueberry, banana) . Insect infestation, contamination and fungal and bacterial diseases can adversely affect the quality and storability of fresh produce, rendering the product unsafe for consumption.
HSI techniques can help assess the safety features of a product. High value food and horticultural products can be susceptible to adulteration or counterfeiting. The HSI technology can be used as a rapid and non-destructive monitoring tool to help identify imitation products or products that have been tampered with. For example, the potential of applying HSI to detect honey adulteration has been demonstrated in Shafiee et al. (2016). The ability of HSI to provide classification of product may also help in authentication of dairy products ensuring their traceability (Gowen et al., 2009). The NZ kiwifruit industry is investigating the use of non-destructive sensors utilising NIR spectroscopy to identify authenticity of kiwifruit cultivars (Piddock, 2016).
Overall, this technology has potential to ensure consumer demanding high quality products and enhanced food safety throughout food chain. It is its application to potato tubers and grading that has caught the interest of Potatoes New Zealand.
References:
Gowen, A.A., Burger, J., O’Callaghan, D., O’Donnell, C., 2009. Potential applications of hyperspectral imaging for quality control in dairy foods, 1st international workshop on computer image analysis in agriculture, Potsdam, Germany.
Piddock, G., 2016. Zespri boss sees bright outlook for kiwifruit industry.
Shafiee, S., Polder, G., Minaei, S., Moghadam-Charkari, N., van Ruth, S., Kuś, P.M., 2016. Detection of Honey Adulteration using Hyperspectral Imaging. IFAC-PapersOnLine 49(16), 311-314.