Sustainable Vegetable Systems Update No.5: Programme Update
The Sustainable Vegetable Systems (SVS) program has made great progress with trials and data forming the foundation for interesting conversations around the support that growers need for improved financial and environmental performance alongside compliance reporting. The highlight from this quarter is that the prototype farmer tool has been developed (see Workstream 3).
Workstream 1 – The Plant & Food Research (PFR) controlled trials at their Hawke’s Bay and Lincoln Research stations. There are 2 trials at Lincoln, most recently in potatoes and onions (Figure 1). Lettuce has been harvested in Hawke’s Bay and peas sown, alongside the onion crop also growing at that site. The prototype of the farmer facing tool under development in Workstream 3 has also been used to estimate the optimum nitrogen requirement for the potato crop in Lincoln.
Workstream 2 – Regional monitoring of crop growth, crop nitrogen uptake and the movement of nitrogen pools within the soil. Onions and carrots have been harvested in Auckland; the maize crop is maturing in the Waikato. In Horowhenua a cabbage crop has been planted and an onion crop nears harvest. Meanwhile, sampling of the squash crop continues in Hawke’s Bay, and wheat and turf grass continue to be monitored in Canterbury. Additional pre-harvest plant biomass sampling of crops not currently in any rotations has also been underway in Canterbury and Pukekohe, with potatoes, spring onions, fancy lettuce, and pumpkin among the range of crops sampled.
Workstream 3 – Development of the nitrogen model. Meetings and discussions have been held to determine the requirements and objectives of the farmer facing tool currently under development. A prototype of the tool has been developed and will be demonstrated to a range of different groups over the next few months.
Workstream 4 – Dissemination of results and outputs. COVID-19 restrictions resulted in grower interviews being conducted via phone or video conference. The data collected from these interviews is being prepared in a report that will be used to inform discussions of the model and tool under development in Workstream 3.
Workstream 1 – Intensive N trials
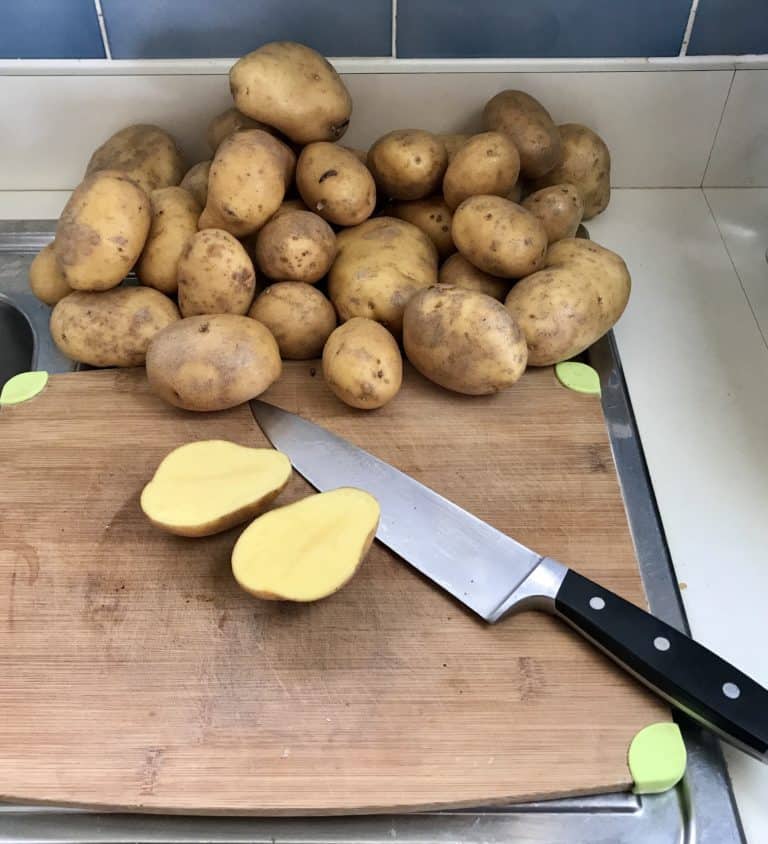
PFR are conducting intensive crop monitoring at two sites across four trial rotations. Each rotation is divided into multiple plots with variable nitrogen treatments. An example of this field experiment methodology is the potato-onion rotation underway at Lincoln. The crop sequence for this rotation is shown in Figure 1. The rotations have been designed with minimal fallow periods to enable as much data collection as possible over the Workstream 1 programme, which finishes in 2023.
At the time of publishing, the onion crop in this rotation will have been harvested and the next crop (at this stage spinach) will have been sown. Figure 1. Canterbury Rotations
The onion crop was divided into four trial plots with different nitrogen fertiliser application rates. The rates applied are shown in Table 1. The optimum rate of fertiliser was determined using the Nutrient Management for Vegetables Handbook (Reid & Morton, 2019), which recommends optimal fertiliser treatments based on desired crop yield, predicted crop nitrogen uptake, and soil nitrogen test results at planting.
In this case, the soil N test values in the top 15 cm of soil showed 54 kg N/ha of available nitrogen. The handbook recommends an optimal nitrogen fertiliser application of 120 kg N/ha to meet the crop requirements given this level of plant available soil nitrogen. This corresponds to the N3 plot in Table 1 and Figure 2. The N1 and N2 treatments in Figure 2 show a lighter green canopy colour, indicating some nitrogen limitation to growth. This is not apparent in the N3 and N4 treatments.
Table 1. Fertiliser application rates applied to onions in the Canterbury rotation.
| Timing | N1 (No N fert.) | N2 (Half N fert.) | N3 (Agreed practice) | N4 (Double N fert.) |
| Planting | 0 | 15 | 30 | 60 |
| Side dress 1 ~ 2 leaf | 0 | 15 | 30 | 60 |
| Side dress 2 ~ 4 leaf | 0 | 15 | 30 | 60 |
| Side dress 3 ~ bulbing | 0 | 15 | 30 | 60 |
| Total | 0 | 60 | 120 | 240 |

Figure 2. Onion plots with different N treatment rates of the Canterbury rotation.
Over the course of the onion crop growth PFR take regular plant samples to measure nitrogen content and biomass. They also take soil samples to monitor mineral and mineralisable nitrogen, and soil bulk density samples for conversion of these results to per hectare units. Lysimeters below ground monitor the rates of drainage and capture portions of this drainage water for analysis of the soluble nitrogen being carried below the root zone.
These measurements capture every pool of nitrogen, with the exception of losses to atmosphere (though these are typically small in relation to the other nitrogen pools), providing PFR the necessary data for the development of the system model that will be embedded in the farmer facing tool.
Workstream 2 – Nitrogen Budget Reports
The first set of plant nitrogen content and yield data from the regional monitoring in Workstream 2 has been reviewed and used to begin the development of nitrogen budget reports. It is intended for these reports to be used by the growers, samplers, and the wider Community of Practice group that is currently being brought together.

Figure 3. Carrots being sampled just prior to harvest in November with sampling continuing through the fallow period.
With the nitrogen content and yield data available most of the nitrogen pools can be accounted for. These can be divided into the nitrogen inputs and the nitrogen outputs. The difference between the two is what SVS is most interested in, with the primary goal of SVS being to empower growers to optimise production while minimising this missing nitrogen pool. Figure 3 shows the components of the nitrogen budgets prepared from the monitoring data in Workstream 2. The inputs include the nitrogen contained in the plant available mineral form in the soil, the soil nitrogen that will be mineralised into the mineral form over the crop growth period, the nitrogen contained in the residue of the previous crop, and the nitrogen added to the system as fertiliser. The outputs are the mineral nitrogen at the time of harvest, the nitrogen contained in the crop residue, and the nitrogen contained in the portion of the crop taken off field. A grower’s goal is to balance the inputs with the outputs as much as possible, while maintaining a safety margin to allow for rainfall and other climatic variations that may affect crop nitrogen supply. The missing nitrogen pool will include nitrogen lost to the atmosphere, nitrogen fixed as organic matter, nitrogen not yet mineralised from the mineralisable pool at planting, and most importantly, soluble nitrogen that has leached below the active root zone.
Figure 4. Components of an N budget for an example crop
Accounting for soil nitrogen (both mineral and mineralisable) and nitrogen in residues from the previous crop is critically important when making fertiliser application decisions. Even simple nitrogen budgets, like the example in Figure 4, allow growers to make informed decisions with more confidence. The nitrogen model being developed in Workstream 3 will provide growers with greater confidence in their decisions, empowering them to reduce the missing nitrogen pool while also reducing the risk of potential loss of crop yield or quality (along with the ability to better sleep at night).
Workstream 3 – Prototype farmer facing tool
The SVS trials and monitoring workstreams feed data to Workstream 3, which is developing the farmer facing tool (there is a prize for whoever comes up with a better name) and the underlying nitrogen model. Several meetings have been conducted to determine the exact purpose, requirements, and functionality of the tool, both from a grower and science perspective.
Figure 5. Output from prototype farmer-facing tool, providing indication of prediction for soil N supply to optimise fresh market potato yield in the Canterbury vegetable rotation.
Following these meetings, a prototype of the tool has been developed and was just recently demonstrated to the Project Governance Group, with an example output from the prototype shown in Figure 5. The user of the tool inputs the sowing date, expected harvest date, and yield. This then establishes a crop nitrogen uptake curve. The user also inputs soil mineral N and Potentially Mineralisable N (PMN) soil test results to the depth appropriate for that crop (in this example a depth of 30 cm was used).
The user can also input information on the previous and subsequent crops to see how the nitrogen balance fits into the wider crop rotation. Inputting information on the previous crop is important to understand the quantity and rate of mineralisation of the previous crop residue, and the impact this has on the current crop.
The prototype also includes a decision support component for fertiliser applications. The user can select the trigger point to apply fertiliser (e.g., 35 kg N/ha) and the number of applications they want to or are able to apply over the crop growth period (e.g., 3 side dressings). The tool then calculates the rate and time of fertiliser application to match the predicted crop nitrogen uptake.
Further work to the prototype will be to include leaching losses as well as investigating the potential to include in-season weather. A lot of discussion has occurred around natural variability and how that is represented in tool. A single number can give a false impression about the uniformity and level of accuracy which doesn’t reflect the realities of vegetable production.
Workstream 4 – Grower interviews
Understanding grower perspectives and their requirements is critical to developing a useful nitrogen tool. Failure to account for grower needs and use patterns will result in the tool not being used, or the results of the tool not being trusted to inform management decisions. Therefore, a key focus of the programme’s Workstream 4 is to give growers the ability to provide their input into the tool’s development.
A PFR social scientist conducted a series of focus groups and interviews to collect and analyse grower knowledge and practice. Two focus groups have been formed with group members representing growers and other industry personnel in several key growing regions. COVID-19 has resulted in some delays to this process due to the difficulty of conducting face-face meetings, but the information from these focus groups is now being incorporated into the Workstream 3 model development process. The intention is to continue a process of focus group discussions throughout the project to keep that two-way conversation going.
The other key task of Workstream 4 is to develop and disseminate educational material about the SVS programme to raise interest in the key issue of nitrogen management and in the development of the farmer facing tool. Additional activities planned for this extension work include a series of podcasts and videos and presentation of programme results and milestones at industry conferences.
SVS – Looking ahead
The trial and monitoring work being conducted in Workstreams 1 and 2 will continue throughout the upcoming autumn and winter period, as the main drainage period this part of the season is of critical importance to the programme. Work will continue on the prototype tool; grower input will keep being collected and methods of extension to the wider industry will keep being developed.
SVS is funded by Ministry for Primary Industries, led and co-funded by Potatoes New Zealand in collaboration with the Vegetable Research & Innovation Board and Horticulture NZ.
SVS is a $7.5 million dollar national project over 4 years and is multi-workstream aimed at providing the data and subsequent modelling of vegetable nutrient uptake and nitrogen leaching.
Overall SVS project aims:
- To maintain vegetable and potato industries’ social license to operate
- To protect the ability to grow, process and sell, while meeting environmental standards
- To ensure industry access to land, water and nutrients through national, regional and farm programs in order to achieve industry growth.
SVS Program Communications